
You will have seen the map shown below – perhaps in a geography text book, and you may have a poster version of the map on a classroom wall somewhere in your Geography Department. There is a version of this map on Google Earth.
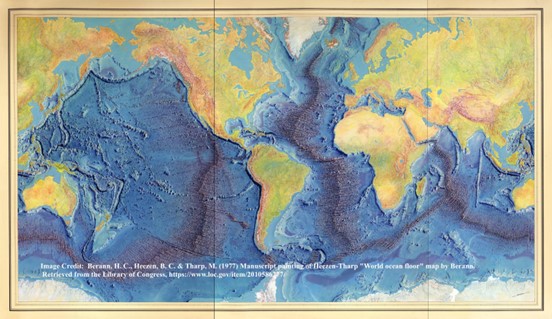
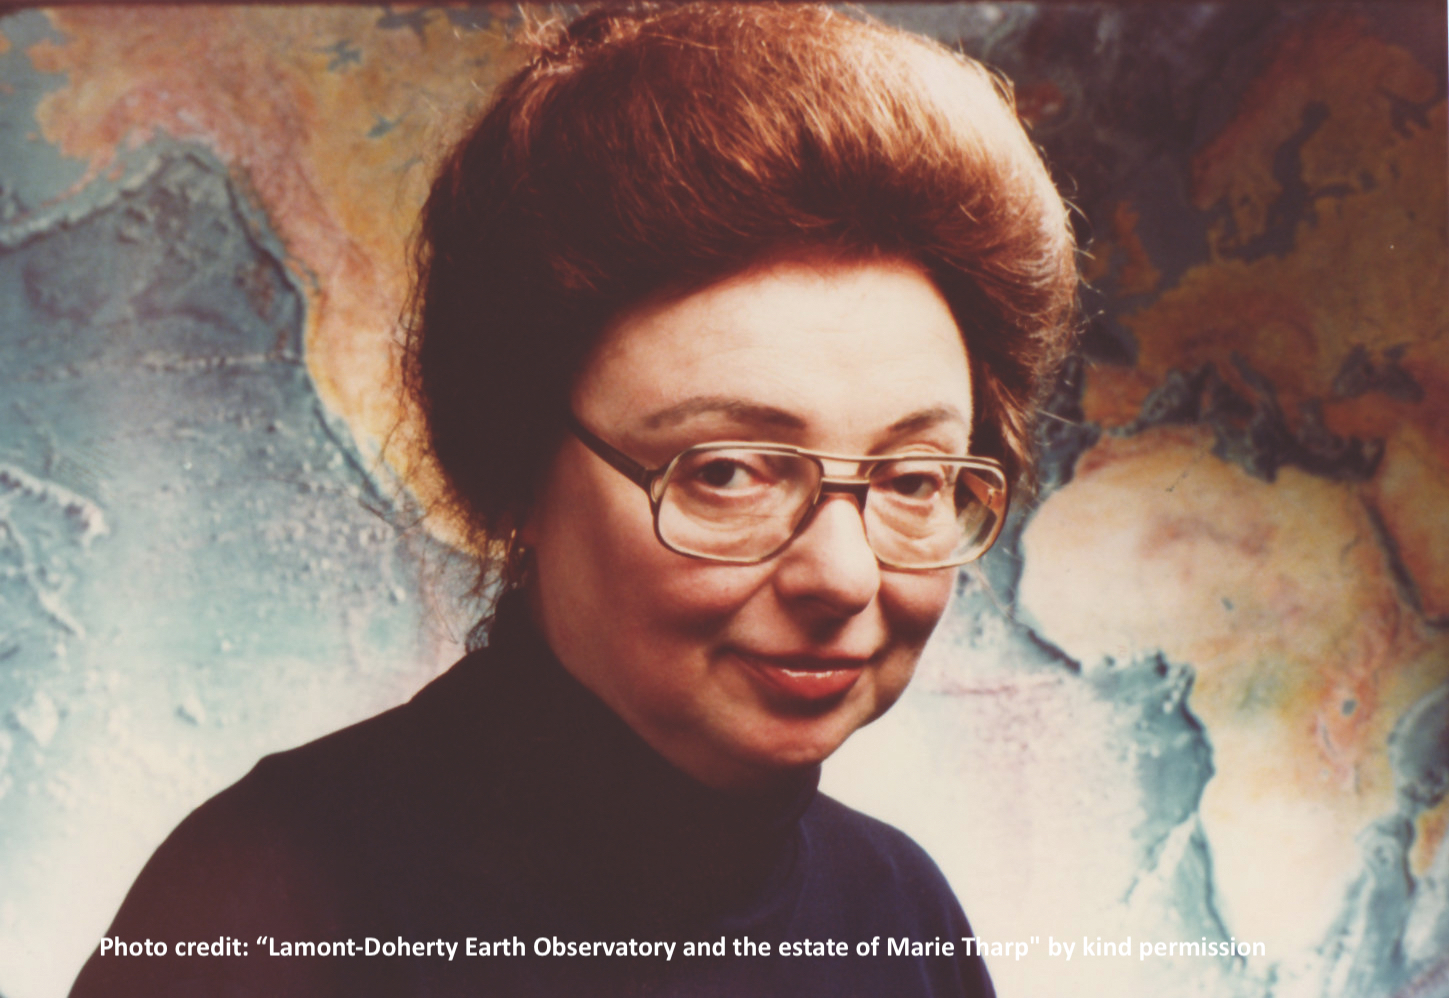
This map of the ’World ocean floor’ portrays a stunning piece of physical geography. It is easy to take the map for ‘granted’ but it is a relatively recent view of our world – this map did not exist until the 1977. It had taken Marie Tharp (1920–2006) 20 years to create ‘physiographic maps’ of the sea floor across the planet, and to compile the image we see by painstakingly plotting data of ocean depth soundings (bathymetric data) collected by scientific surveys on ships.
Marie had started working on the bathymetric data in the early 1950s. She had the idea of drawing east-west profiles across the North Atlantic, and these revealed evidence of an extensive undersea ‘mountainous’ ridge structure, with a rift (or gap) in the centre. Marie thought the rift might be formed by the oceanic surface being pulled apart, which would require sea-floor spreading and continental drift but as this did not fit the ideas of the time (this was pre-plate tectonic theory) so the ‘rift’ and her idea was dismissed as “girl talk”. It was not only that her interpretation was controversial, but as it came from a woman it had lesser status amongst her male geoscientist colleagues. Again, this was an attitude of the period in which Marie worked.
Not deterred, Marie worked patiently and carefully on her data and after a year or so she had processed enough data to convince her co-worker, Bruce Heezen (who had collected the data – as a woman Maria was not allowed on a scientific ship), that her evidence of the central rift valley was real.
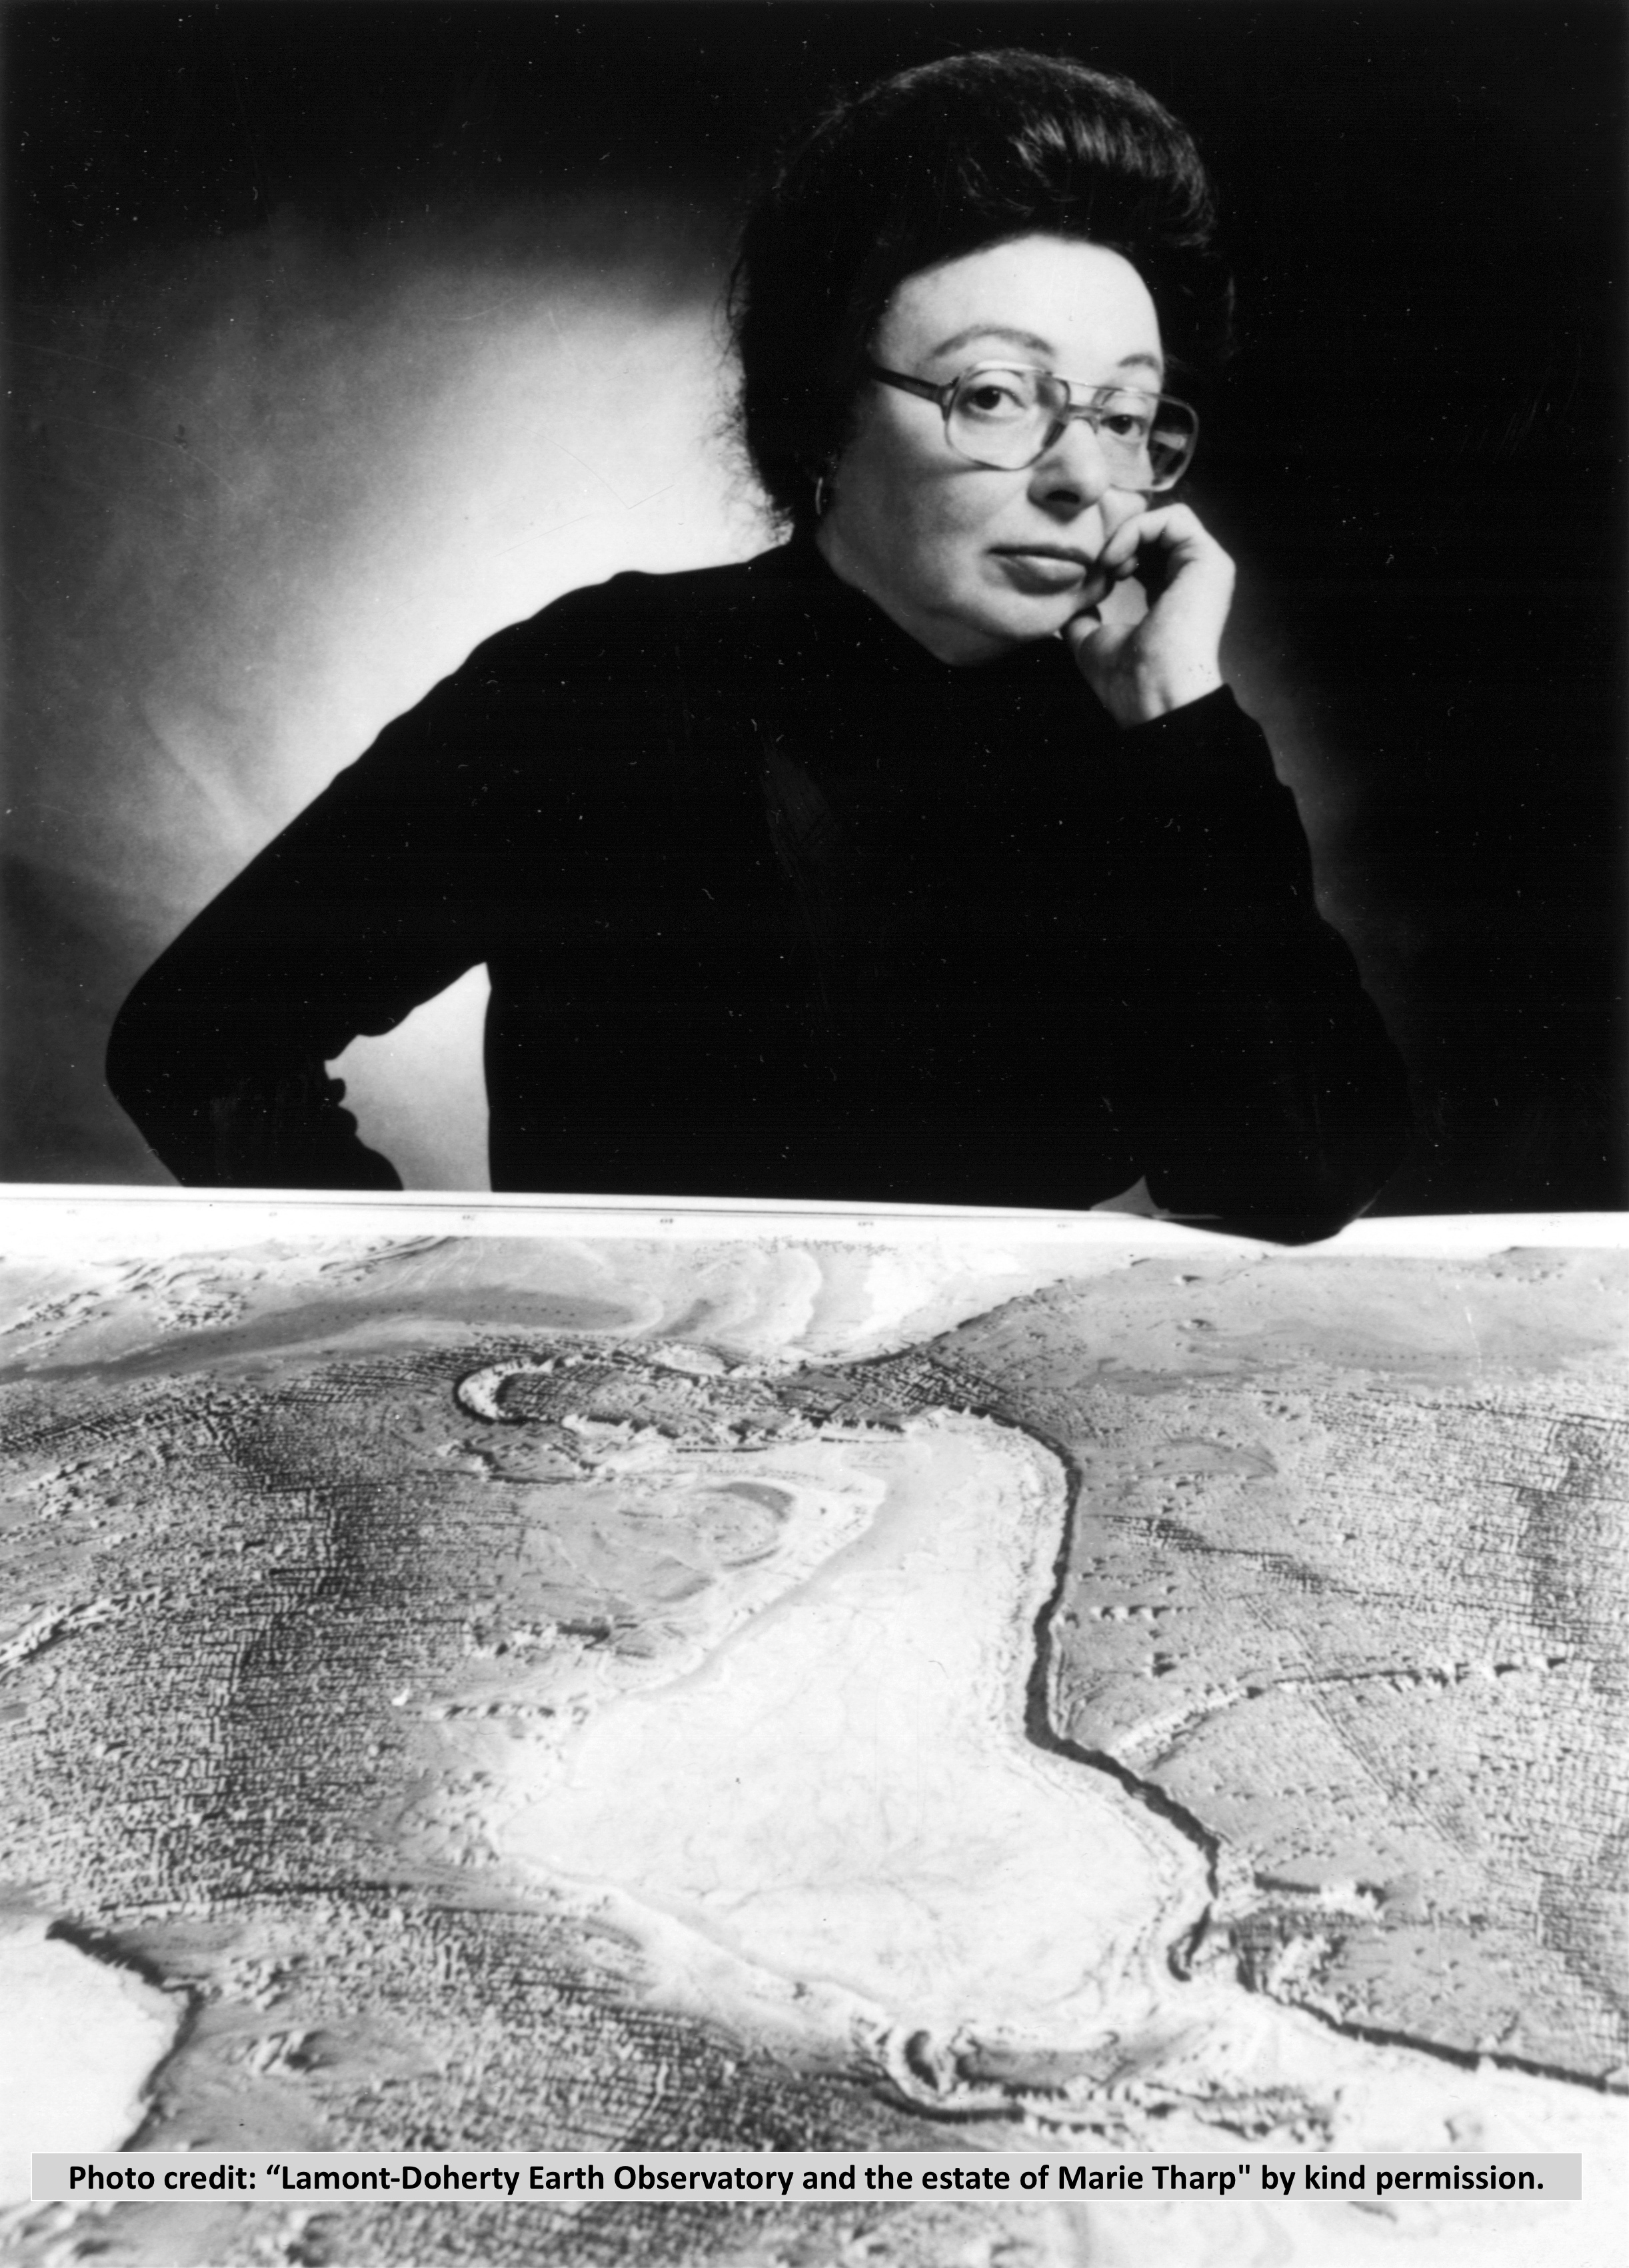
The pair worked on drawing a map of the North Atlantic seafloor. However this could not be a contour map, as this was the time of the ‘Cold War’ and it was feared such maps could be used by the Soviets. So, instead Marie used her skills in mapping and set about re-plotting the data as a physiographic ‘picture’ of the underwater terrain, and the result was a very striking visual image, published in 1957.
It must be remembered that in the 1950s no-one had ever visited the deep of the oceans, so Marie’s submarine topography was a bold claim to make. Tharp and Heezen had to convince doubting geographers and geoscientists that the mid-ocean ridge and rift existed. Amongst the doubters was the famous ocean explorer Jaques Cousteau. In 1959 he took his ship The Calypso and a copy of Marie’s map across the Atlantic to prove her interpretation was wrong, but was surprised when his underwater camera showed the opposite – the mid-Atlantic rift really existed and there was now film footage to prove it!
Heezen was also involved in a project to plot earthquake epicentres in the oceans (to help predict where submarine cables might break), and he noticed that many correlated with Marie’s rift valley, suggesting the ocean floor was being pulled apart. He thought this could be explained by the emerging plate tectonic theory, and the Heezen and Tharp map became a crucial part of the evidence for the plate tectonic theory. But it was Heezen’s name that appeared first on the map, and in fact, the early scientific papers also only had Heezen’s name on them. Marie did not complain publicly, but worked diligently and continued to strengthen and argue her case from within her workplace. So, from 1963 onwards she began to be named and given credit for her work. She was even allowed to go on a ship to collect data in 1968, but by then the shift towards better equality for women had begun.
By the time of the publication of the ‘World ocean floor’ poster map in 1977 Marie’s interpretation was now fully accepted and further evidence across the globe had confirmed her detail. Six years later she retired from her work in 1983, aged 63, having made an outstanding impact on our understanding of planet Earth.
Marie Tharp’s contribution to physical geography is undoubtedly inspirational:
- Her work highlighted the significant roles and contributions women could make to knowledge abut how the world works, if they were taken seriously.
- She never gave up, or complained at mistreatment, but was determined to work harder and more carefully to show the merit of her work, and so earned trust, recognition and shift towards more tolerant views of female capabilities from her male colleagues.
- Her map of the sea floor, which revealed the pattern of oceanographic topography we are now so familiar with, was a key part of the jigsaw puzzle of evidence brought together as a convincing plate tectonic theory.
- She had the perseverance to work on her innovative vision of how the sea floor could be portrayed in a way that people could understand.
Marie Tharp remains an inspirational physical geographer whose story deserves to be shared with students.
Useful resources:
Video: The Amoeba People – song ‘Girl Talk – The story of Marie Tharp’
Video: Marie Tharp: mapping the deep – a short and play-acting presentation.
Website about Marie and her work from the Institution where she worked, with many useful resources.
https://marietharp.ldeo.columbia.edu/
Earth Learning Idea: a teaching activity that helps students to think what it might have been like to be a female scientist at a time when science (and geography) was dominated by men Marie Tharp: ‘The valley will be coming up soon’. Bruce Heezen: ‘What valley?’
https://www.earthlearningidea.com/PDF/353_Sea_floor_mapping4.pdf
A Google search will show there are many other articles, resources and books on the life and work of Marie Tharp available.
Leave a Reply